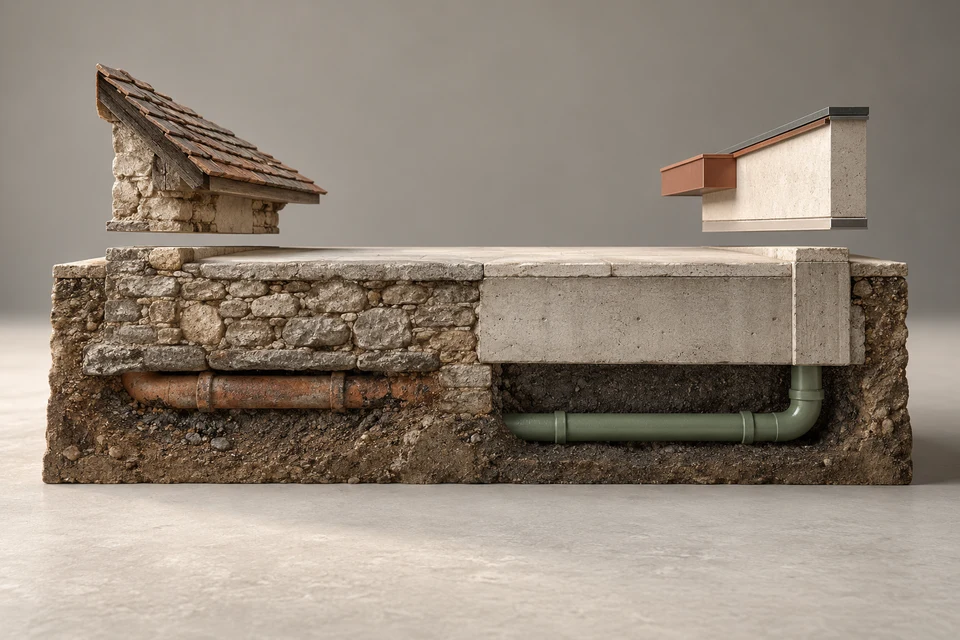
For a buyer, the City of Calgary's records split the city into clear sewer territories. Large 1960s and 1970s communities in every quadrant, from Lake Bonavista to Rundle to Varsity, are overwhelmingly clay tile on the City side. Cast iron is concentrated in 1950s and 1960s pockets in the west and inner north. The figures describe the City-owned portion only.
- Sixteen Calgary communities with 1,500 or more City-side lines are at least 80% TIL, generally clay tile — a large share of the resale market.
- Cast iron is the majority City-side material in Rosscarrock (56.6%) and St. Andrews Heights (53.1%), and over 40% in Spruce Cliff, Cambrian Heights and Bowness.
- Some 1950s suburbs are mostly clay while others are mostly codes the City does not define, so an era alone does not tell you the pipe.
- Communities built across the late 1970s and early 1980s are mixed street by street, so the address matters more than the community.
- Use community data to decide how hard to push for a scope, never as a substitute for one.
01 /Why does a community's sewer data matter to a buyer?
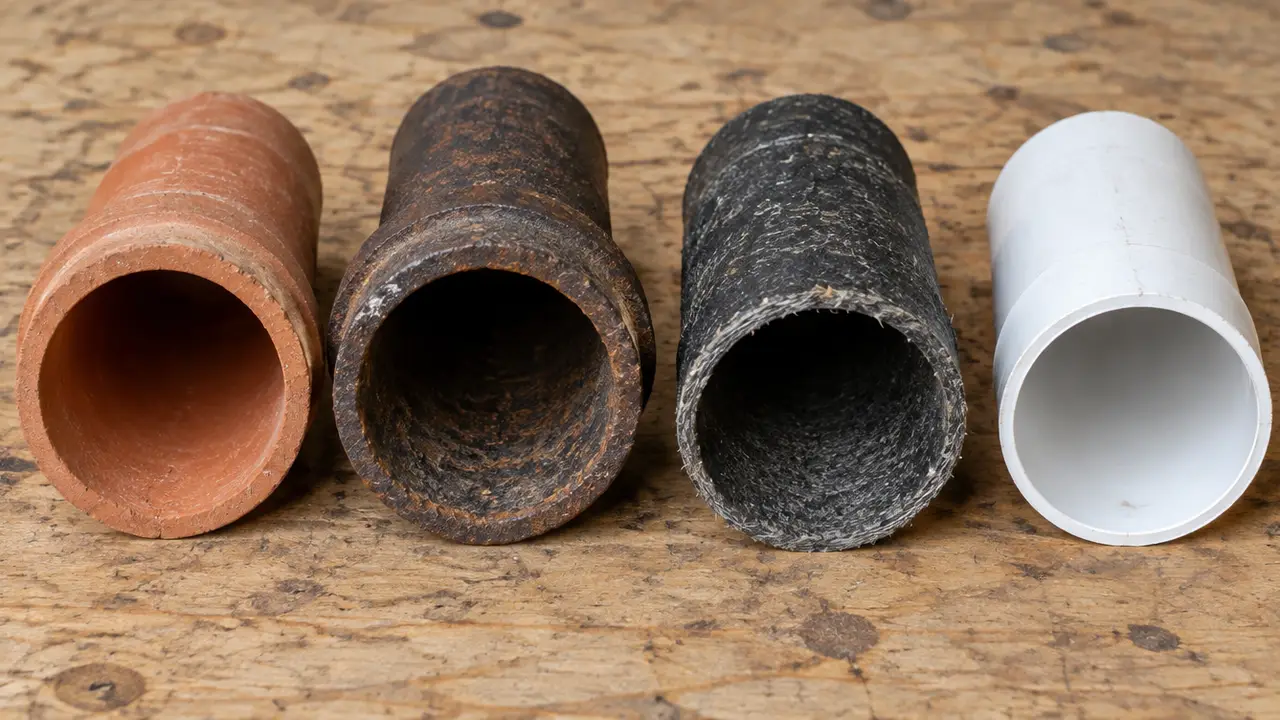
A community's service line data tells a buyer what the City laid under the street side of its lots and when. Because most houses in a subdivision were connected at roughly the same time, often by the same builders, the City-side pattern is a reasonable first guess at what the private side was laid in too. It is only a guess. The City's dataset description puts the property-line-to-house section in the homeowner's hands, and that section may have been laid, repaired or replaced on a completely different schedule.
The tables below are a HAUSE analysis of the City of Calgary's Public Sanitary Service Lines open data, joined to community boundaries. Each line is counted in the community where its first mapped point falls, communities under 20 lines are left out, and large commercial and multi-family services are not part of the dataset. TIL is read here as clay tile, the usual interpretation, though the City's metadata leaves it unexplained, as it does TP and OTHER.
02 /Which large Calgary communities are mostly clay tile?
Buyers shop where the houses are, so this table focuses on the larger communities: those with 1,500 or more City-side service lines in which at least 80% carry the TIL code. Together they hold well over 35,000 City-side lines, and they are spread across every quadrant.
| Community | Quadrant | Lines | % TIL | % PVC | % relined |
|---|---|---|---|---|---|
| Rundle | NE | 2,312 | 97.1 | 2.1 | 0.4 |
| Marlborough Park | NE | 2,138 | 96.9 | 2.8 | 0.0 |
| Willow Park | SE | 1,596 | 96.0 | 3.0 | 0.3 |
| Penbrooke Meadows | SE | 2,234 | 94.1 | 2.6 | 0.0 |
| Acadia | SE | 2,445 | 93.7 | 2.2 | 0.5 |
| Lake Bonavista | SE | 3,272 | 93.3 | 2.8 | 1.0 |
| Marlborough | NE | 2,484 | 92.6 | 4.8 | 0.4 |
| Ranchlands | NW | 2,044 | 92.6 | 3.0 | 1.9 |
| Brentwood | NW | 2,010 | 92.5 | 3.0 | 2.1 |
| Dalhousie | NW | 2,223 | 89.3 | 6.9 | 2.8 |
| Southwood | SW | 1,742 | 88.4 | 4.0 | 2.9 |
| Lakeview | SW | 1,777 | 88.1 | 8.1 | 3.0 |
| Abbeydale | NE | 1,791 | 86.3 | 12.8 | 0.5 |
| Varsity | NW | 2,769 | 85.0 | 9.8 | 2.3 |
| Huntington Hills | NW | 3,838 | 82.1 | 9.2 | 6.8 |
| Silver Springs | NW | 2,819 | 81.3 | 15.7 | 1.8 |
The PVC column is the telling one for a buyer. In most of these communities fewer than one City-side line in ten has been replaced with PVC, which suggests most services are still running on their original clay decades after the houses were built. Smaller communities show the same pattern even more strongly: Maple Ridge is 99.1% TIL, and Parkland, Bonavista Downs, Fairview, Queensland, Palliser, Braeside, Chinook Park, Kelvin Grove, North Haven and Charleswood all sit above 82%.
In a community like these, the useful question is not whether the house has clay, but how its clay has aged. Expect roots at joints where there are mature trees, and expect contractors to discuss lining before digging.
03 /Where are Calgary's cast iron pockets, and what else is there?
Cast iron shows up in smaller, older pockets, mostly 1950s and 1960s communities in the west and inner north. Cast iron laterals corrode from the inside into rough scale that catches paper and narrows the bore; the typical remedies are descaling and lining, or replacement where the wall has thinned. Few of these communities are cast iron alone, so the table shows the rest of the mix a buyer might find next door.
| Community | Lines | % cast iron | % TIL | % PVC |
|---|---|---|---|---|
| Rosscarrock | 1,008 | 56.6 | 0.0 | 26.2 |
| St. Andrews Heights | 409 | 53.1 | 0.0 | 27.4 |
| Spruce Cliff | 489 | 46.8 | 2.9 | 33.7 |
| Cambrian Heights | 769 | 43.7 | 4.9 | 9.5 |
| Bowness | 3,571 | 41.6 | 6.0 | 17.9 |
| Montgomery | 1,638 | 34.9 | 17.2 | 41.3 |
| Rutland Park | 375 | 34.7 | 0.0 | 14.1 |
| Forest Lawn | 1,909 | 27.6 | 3.6 | 10.2 |
| Highland Park | 1,321 | 27.5 | 2.7 | 31.9 |
| Albert Park/Radisson Heights | 1,466 | 25.0 | 27.4 | 25.0 |
| Banff Trail | 1,340 | 24.9 | 1.2 | 26.6 |
| Glenbrook | 1,716 | 24.5 | 29.3 | 31.1 |
| Ogden | 2,765 | 24.2 | 44.0 | 9.4 |
Glenbrook and Albert Park/Radisson Heights are the clearest examples of mixed ground: roughly a quarter to a third each of cast iron, clay tile and PVC on the City side. In communities like these, two houses on the same block can need completely different repairs.
04 /Which 1950s suburbs have the oldest lines, and what are they made of?
The 1950s suburbs outside the inner city have some of Calgary's oldest service line records, and they are not uniform. Some are mostly clay tile; others are mostly under codes the City does not define, which tells a buyer the line is old without saying what it is.
| Community | Median year | % pre-1960 | % TIL | % cast iron | % other |
|---|---|---|---|---|---|
| Wildwood | 1956 | 81.1 | 8.9 | 0.8 | 74.4 |
| Kingsland | 1957 | 73.7 | 6.2 | 13.7 | 74.6 |
| Highwood | 1956 | 54.5 | 2.2 | 7.9 | 52.2 |
| Glendale | 1958 | 67.5 | 12.7 | 1.5 | 56.4 |
| Cambrian Heights | 1957 | 75.8 | 4.9 | 43.7 | 40.6 |
| Westgate | 1958 | 82.9 | 45.5 | 0.2 | 41.8 |
| Rosemont | 1958 | 64.1 | 39.8 | 3.3 | 26.2 |
| Haysboro | 1958 | 82.0 | 78.4 | 1.0 | 13.4 |
| Collingwood | 1959 | 54.7 | 73.2 | 3.2 | 4.2 |
| Chinook Park | 1959 | 52.0 | 89.5 | 0.4 | 1.8 |
Read the last column first. In Wildwood and Kingsland, about three quarters of City-side records are under other codes, most likely the unexplained TP and OTHER codes, both of which cluster in 1950s installs. In Haysboro, Collingwood and Chinook Park, the same decade produced mostly clay tile. A buyer comparing a 1957 bungalow in Kingsland with one in Haysboro is comparing an unknown with a known, and should scope both. Central communities with even older records are covered on the inner city page.
05 /Where has relining already reached clay and older lines?
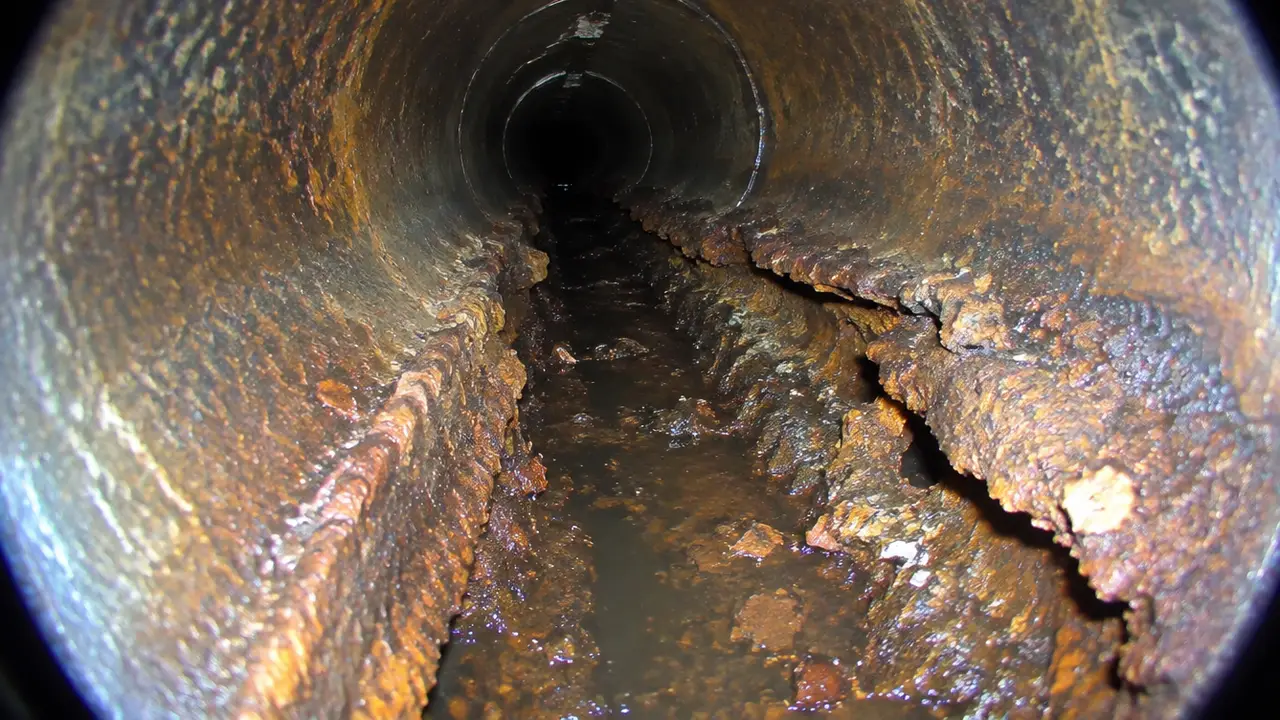
Relining on the City side has progressed furthest in some of the older clay and mixed communities. A CIPP record's date is usually the relining date, so these are older lines renewed recently, most of them in the 2010s and 2020s. Seeing relining next to a large remaining TIL share tells you work is under way in the neighbourhood, not that it is finished. If a house you are viewing shows a relined record, see buying a home with a relined sewer line.
| Community | % relined (CIPP) | % TIL | % PVC |
|---|---|---|---|
| University Heights | 19.9 | 73.3 | 6.2 |
| Glendale | 19.9 | 12.7 | 9.5 |
| Rosemont | 16.6 | 39.8 | 14.1 |
| Glamorgan | 12.5 | 50.7 | 7.8 |
| Collingwood | 11.0 | 73.2 | 8.4 |
| Charleswood | 7.4 | 82.2 | 8.1 |
| Huntington Hills | 6.8 | 82.1 | 9.2 |
| Dover | 6.6 | 78.6 | 9.1 |
| Westgate | 6.4 | 45.5 | 6.1 |
| Coach Hill | 5.2 | 72.1 | 19.5 |
06 /What about communities that are half clay and half PVC?
Communities built across the switch from clay to PVC, roughly the late 1970s and early 1980s, are the hardest to read. Castleridge is 46.6% TIL and 51.9% PVC; Whitehorn 43.3% and 51.8%; Falconridge 39.6% and 59.8%; Woodbine 38.4% and 60.4%; Cedarbrae 37.5% and 60.2%; Woodlands 42.3% and 55.9%; Edgemont 25% and 74.3%. In these areas, one street may have been serviced in clay and the next in PVC a year or two later.
That is where the address lookup earns its keep. The Home Buyer Sewer Risk Check can read the City-side record for a specific address and pre-fill the material and year before you score the house.
07 /What do these community patterns mean for a buyer's budget?
A community's dominant material points to the remedy a contractor is most likely to propose if the private side matches, and that sets the budget you should hold in reserve while you negotiate. The table uses the Calgary estimator's ranges for a 15 m lateral at typical depth under lawn, in summer, with no City-side work.
| Community pattern | Most common remedy if defects are found | Planning range for 15 m |
|---|---|---|
| Clay tile belt (1960s–1970s) | Root cutting, then lining if joints are failing along the run | $10,000–$26,250 to line |
| Cast iron pocket (1950s–1960s) | Descaling and lining, or replacement where walls are thin | $10,000–$30,500 |
| Mostly older unexplained codes | Unknown until scoped; budget for full replacement | $14,250–$30,500 by open cut |
| Mixed clay and PVC (late 1970s–early 1980s) | Depends on the street; scope decides | From maintenance to $30,500 |
Hold the upper end of the range in reserve until a scope and a written quote narrow it. A buyer who has budgeted for the top of the range negotiates calmly; one who has budgeted for nothing negotiates under pressure.
08 /How should I use this when house hunting?
- Check the community
Find it in the tables above or in the full atlas on CalgarySewers.ca.
- Check the address
Use the lookup in the risk check to read the City-side record for the specific house.
- Score the house
Add trees, basement, disclosure and scope status in the Home Buyer Sewer Risk Check.
- Scope before firm
Book a camera inspection early in the condition period; see sewer scope before buying in Calgary.
- Price anything found
Use the Calgary Replacement Cost Estimator and get a written quote.
If the City's record for an address looks wrong, the City invites corrections through 311. For what these materials mean for your budget over time, see Calgary sewer replacement cost by community era.
FAQQuestions people ask
Which Calgary neighbourhoods have clay sewer pipes?
Among the larger communities, Rundle, Marlborough Park, Willow Park, Penbrooke Meadows, Acadia and Lake Bonavista are each above 93% TIL on the City side, and many more 1960s and 1970s communities are above 80%.
Does a clay tile community mean my house has clay pipe?
Not necessarily. The data covers the City-owned portion only. The private portion may match, may have been replaced, or may be a different material. A scope tells you.
Where is cast iron sewer pipe most common in Calgary?
Rosscarrock and St. Andrews Heights are majority cast iron on the City side, and Spruce Cliff, Cambrian Heights and Bowness are all above 40%.
Is a 1950s Calgary house more likely to have clay or cast iron?
Either, or neither. Haysboro and Chinook Park are mostly clay tile, Cambrian Heights is heavily cast iron, and Wildwood and Kingsland are mostly under codes the City does not define.
How up to date is the City's service line record?
The analysis uses the City's Public Sanitary Service Lines dataset with rows updated September 1, 2026, fetched September 24, 2026.
NETWORKGo deeper across the HAUSE Sewer network
Lateral defect map: plot your sewer inspection findings
Turn a sewer camera report into a strip map: enter footage-counter distances, defect types and depths to see where each finding sits and how urgent it is.
PipeCleaning.caPipe cleaning methods compared, method by method
Pipe cleaning methods compared: snaking, hydro jetting, descaling, chain knockers, enzymes and chemicals — what each removes, and which pipes each can harm.
SewerJetting.caIs hydro jetting safe for old pipes?
Is hydro jetting safe for old pipes? How jetting affects vitrified clay, cast iron, Orangeburg, concrete and plastic, and why camera-first matters.